Abstract
Field experiments were conducted at El-Bustan Agricultural Research Station, in summer season of 2013 on peanut (Arachis hypogaea L.) variety Giza 5, to study the effect of sprinkler irrigation management and the application of rice straw mulch on yield, quality, water consumptive use and crop coefficient of peanut in sandy soil. Two irrigation treatments, (I3) and (I5) were imposed based on the soil water depletion to bring the soil water deficit to the field capacity at two irrigation intervals of 3 and 5 days. Mulching treatments were applied randomly during the 3-leaf growth stage for one half of the experimental area (M) at a rate of about 500 g/m2, while the other half remained bare (non-mulched, Mo). The experimental design was split- plot with three replications and consisted of irrigation treatments in the main plots, mulching and non-mulching treatments as subplots. The results revealed that, higher yield and better crop growth were observed in the mulched plots as compared to nonmulched plots under the same irrigation treatments. Also, the effect of I3 treatment was more pronounced than the effect of I5 treatments. The average values of maximum plant length, No. of pods/plant, pods weight/plant, total Bio-mass, 100 kernels weight ,total pods yield and total kernels yield, were 65.00 cm, 39.45, 53.20 g., 4012.05 kg/fed, 67.10 g, 1658.80 kg/fed and 1176.00 kg/fed, respectively observed with I3M treatment. An increase in the tested quality parameters such as shelling percent, protein and oil percentage, of 8.9, 4.40 and 2.13%, respectively were obtained with I3M treatment as compared to the control treatment (I3MO). The computed ETO value in course of the peanut growth season was 752.25 mm. I3MO treatment had the maximum ETC and applied irrigation water (AIW) values of 2415.0 and 2952.60 m3/fed, respectively. Applying rice straw mulch conserved irrigation water by about 14.37 and 21.62% with I3 and I5 treatments, respectively. WUE ranged from 0.60 with I3M and I5M to 0.36 kg/m3 with I5MO treatment, meanwhile, I5M and I3M treatments had the maximum IWUE values of 0.48 and 0.47 kg/m3, respectively. The maximum crop coefficient (KC) value of 0.88 occurred during July, which was less than the generic value listed in FAO-33and-56 by about 16.2 and 10.2%, respectively, however the average KC values of peanut at El-Bustan area of 0.73 was close to FAO-33 and-56 listed values. These results showed that precise management of the available soil moisture content in the course of the growing season, and accurate estimation of ETC as well as, developing site and cultivar specific KC value can be effective way for appropriate irrigation scheduling and water allocation, saving water, maximizing yield and consequently optimizing the economic return.
Abstract from the paper’s OpenAlex record, shown for indexing and research. Copyright remains with the authors or the publisher. Read at the source ↗
The text the model read, with the source record’s inline markup (italics, sub- and superscripts) rendered and its character entities decoded; quote offsets refer to the raw text.
Claims 20
Claim · model-written summary
Mulched peanut plots had higher yield and better growth than nonmulched plots.
- Taxon
- peanut
 Arachis hypogaeae1
- Treatment
- mulched plotse0
- Outcome
- yield and better crop growthe0
- Direction
- highere0
- Comparator
- nonmulched plotse0
Organisms pictured · Representative pictures of the matched species, not figures from the paper.
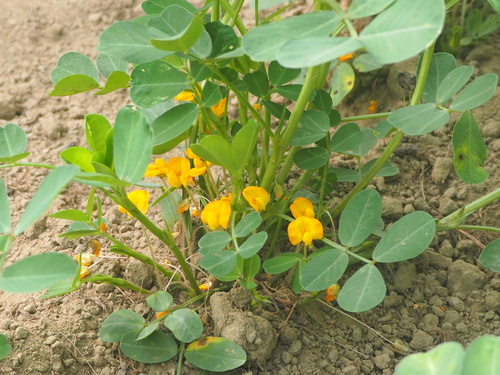
Verbatim
e0“higher yield and better crop growth were observed in the mulched plots as compared to nonmulched plots under the same irrigation treatments”
e1“peanut (Arachis hypogaea L.)”
Claim · model-written summary
I3 had a more pronounced effect than I5.
- Taxon
- peanutArachis hypogaeae1
- Treatment
- I3 treatmente0
- Outcome
- more pronouncede0
- Direction
- more pronouncede0
- Comparator
- I5 treatmentse0
Organisms pictured · Representative pictures of the matched species, not figures from the paper.
Verbatim
e0“the effect of I3 treatment was more pronounced than the effect of I5 treatments”
e1“peanut (Arachis hypogaea L.)”
Claim · model-written summary
I3M peanut maximum plant length averaged 65.00 cm.
- Taxon
- peanutArachis hypogaeae1
- Treatment
- I3M treatmente0
- Outcome
- maximum plant lengthe0
- Value
- 65.00 cme0
Organisms pictured · Representative pictures of the matched species, not figures from the paper.
Verbatim
e0“The average values of maximum plant length, No. of pods/plant, pods weight/plant, total Bio-mass, 100 kernels weight ,total pods yield and total kernels yield, were 65.00 cm, 39.45, 53.20 g., 4012.05 kg/fed, 67.10 g, 1658.80 kg/fed and 1176.00 kg/fed, respectively observed with I3M treatment.”
e1“peanut (Arachis hypogaea L.)”
Claim · model-written summary
I3M peanut No. of pods/plant averaged 39.45.
- Taxon
- peanutArachis hypogaeae1
- Treatment
- I3M treatmente0
- Outcome
- No. of pods/plante0
- Value
- 39.45e0
Organisms pictured · Representative pictures of the matched species, not figures from the paper.
Verbatim
e0“The average values of maximum plant length, No. of pods/plant, pods weight/plant, total Bio-mass, 100 kernels weight ,total pods yield and total kernels yield, were 65.00 cm, 39.45, 53.20 g., 4012.05 kg/fed, 67.10 g, 1658.80 kg/fed and 1176.00 kg/fed, respectively observed with I3M treatment.”
e1“peanut (Arachis hypogaea L.)”
Claim · model-written summary
I3M peanut pods weight/plant averaged 53.20 g..
- Taxon
- peanutArachis hypogaeae1
- Treatment
- I3M treatmente0
- Outcome
- pods weight/plante0
- Value
- 53.20 g.e0
Organisms pictured · Representative pictures of the matched species, not figures from the paper.
Verbatim
e0“The average values of maximum plant length, No. of pods/plant, pods weight/plant, total Bio-mass, 100 kernels weight ,total pods yield and total kernels yield, were 65.00 cm, 39.45, 53.20 g., 4012.05 kg/fed, 67.10 g, 1658.80 kg/fed and 1176.00 kg/fed, respectively observed with I3M treatment.”
e1“peanut (Arachis hypogaea L.)”
Claim · model-written summary
I3M peanut total Bio-mass averaged 4012.05 kg/fed.
- Taxon
- peanutArachis hypogaeae1
- Treatment
- I3M treatmente0
- Outcome
- total Bio-masse0
- Value
- 4012.05 kg/fede0
Organisms pictured · Representative pictures of the matched species, not figures from the paper.
Verbatim
e0“The average values of maximum plant length, No. of pods/plant, pods weight/plant, total Bio-mass, 100 kernels weight ,total pods yield and total kernels yield, were 65.00 cm, 39.45, 53.20 g., 4012.05 kg/fed, 67.10 g, 1658.80 kg/fed and 1176.00 kg/fed, respectively observed with I3M treatment.”
e1“peanut (Arachis hypogaea L.)”
Claim · model-written summary
I3M peanut 100 kernels weight averaged 67.10 g.
- Taxon
- peanutArachis hypogaeae1
- Treatment
- I3M treatmente0
- Outcome
- 100 kernels weighte0
- Value
- 67.10 ge0
Organisms pictured · Representative pictures of the matched species, not figures from the paper.
Verbatim
e0“The average values of maximum plant length, No. of pods/plant, pods weight/plant, total Bio-mass, 100 kernels weight ,total pods yield and total kernels yield, were 65.00 cm, 39.45, 53.20 g., 4012.05 kg/fed, 67.10 g, 1658.80 kg/fed and 1176.00 kg/fed, respectively observed with I3M treatment.”
e1“peanut (Arachis hypogaea L.)”
Claim · model-written summary
I3M peanut total pods yield averaged 1658.80 kg/fed.
- Taxon
- peanutArachis hypogaeae1
- Treatment
- I3M treatmente0
- Outcome
- total pods yielde0
- Value
- 1658.80 kg/fede0
Organisms pictured · Representative pictures of the matched species, not figures from the paper.
Verbatim
e0“The average values of maximum plant length, No. of pods/plant, pods weight/plant, total Bio-mass, 100 kernels weight ,total pods yield and total kernels yield, were 65.00 cm, 39.45, 53.20 g., 4012.05 kg/fed, 67.10 g, 1658.80 kg/fed and 1176.00 kg/fed, respectively observed with I3M treatment.”
e1“peanut (Arachis hypogaea L.)”
Claim · model-written summary
I3M peanut total kernels yield averaged 1176.00 kg/fed.
- Taxon
- peanutArachis hypogaeae1
- Treatment
- I3M treatmente0
- Outcome
- total kernels yielde0
- Value
- 1176.00 kg/fede0
Organisms pictured · Representative pictures of the matched species, not figures from the paper.
Verbatim
e0“The average values of maximum plant length, No. of pods/plant, pods weight/plant, total Bio-mass, 100 kernels weight ,total pods yield and total kernels yield, were 65.00 cm, 39.45, 53.20 g., 4012.05 kg/fed, 67.10 g, 1658.80 kg/fed and 1176.00 kg/fed, respectively observed with I3M treatment.”
e1“peanut (Arachis hypogaea L.)”
Claim · model-written summary
I3M raised peanut shelling percent by 8.9 versus I3MO.
- Taxon
- peanutArachis hypogaeae1
- Treatment
- I3M treatmente0
- Outcome
- shelling percente0
- Direction
- increasee0
- Value
- 8.9e0
- Comparator
- I3MOe0
Organisms pictured · Representative pictures of the matched species, not figures from the paper.
Verbatim
e0“An increase in the tested quality parameters such as shelling percent, protein and oil percentage, of 8.9, 4.40 and 2.13%, respectively were obtained with I3M treatment as compared to the control treatment (I3MO).”
e1“peanut (Arachis hypogaea L.)”
Claim · model-written summary
I3M raised peanut protein by 4.40 versus I3MO.
- Taxon
- peanutArachis hypogaeae1
- Treatment
- I3M treatmente0
- Outcome
- proteine0
- Direction
- increasee0
- Value
- 4.40e0
- Comparator
- I3MOe0
Organisms pictured · Representative pictures of the matched species, not figures from the paper.
Verbatim
e0“An increase in the tested quality parameters such as shelling percent, protein and oil percentage, of 8.9, 4.40 and 2.13%, respectively were obtained with I3M treatment as compared to the control treatment (I3MO).”
e1“peanut (Arachis hypogaea L.)”
Claim · model-written summary
I3M raised peanut oil percentage by 2.13% versus I3MO.
- Taxon
- peanutArachis hypogaeae1
- Treatment
- I3M treatmente0
- Outcome
- oil percentagee0
- Direction
- increasee0
- Value
- 2.13%e0
- Comparator
- I3MOe0
Organisms pictured · Representative pictures of the matched species, not figures from the paper.
Verbatim
e0“An increase in the tested quality parameters such as shelling percent, protein and oil percentage, of 8.9, 4.40 and 2.13%, respectively were obtained with I3M treatment as compared to the control treatment (I3MO).”
e1“peanut (Arachis hypogaea L.)”
Claim · model-written summary
Seasonal ETO was 752.25 mm.
- Taxon
- peanutArachis hypogaeae1
- Outcome
- ETOe0
- Value
- 752.25 mme0
Organisms pictured · Representative pictures of the matched species, not figures from the paper.
Verbatim
e0“The computed ETO value in course of the peanut growth season was 752.25 mm”
e1“peanut (Arachis hypogaea L.)”
Claim · model-written summary
I3MO had maximum ETC of 2415.0 m3/fed.
Organisms pictured · Representative pictures of the matched species, not figures from the paper.
Verbatim
e0“I3MO treatment had the maximum ETC and applied irrigation water (AIW) values of 2415.0 and 2952.60 m3/fed, respectively”
e1“peanut (Arachis hypogaea L.)”
Claim · model-written summary
I3MO had maximum applied irrigation water of 2952.60 m3/fed.
- Taxon
- peanutArachis hypogaeae1
- Treatment
- I3MO treatmente0
- Outcome
- applied irrigation water (AIW)e0
- Direction
- maximume0
- Value
- 2952.60 m3/fede0
Organisms pictured · Representative pictures of the matched species, not figures from the paper.
Verbatim
e0“I3MO treatment had the maximum ETC and applied irrigation water (AIW) values of 2415.0 and 2952.60 m3/fed, respectively”
e1“peanut (Arachis hypogaea L.)”
Claim · model-written summary
Rice straw mulch conserved irrigation water by 14.37 under I3.
- Taxon
- peanutArachis hypogaeae1
- Treatment
- rice straw mulche0
- Outcome
- irrigation watere0
- Direction
- conservede0
- Value
- 14.37e0
- Qualifier
- I3e0
Not reportedComparator
Organisms pictured · Representative pictures of the matched species, not figures from the paper.
Verbatim
e0“Applying rice straw mulch conserved irrigation water by about 14.37 and 21.62% with I3 and I5 treatments, respectively”
e1“peanut (Arachis hypogaea L.)”
Claim · model-written summary
Rice straw mulch conserved irrigation water by 21.62% under I5.
- Taxon
- peanutArachis hypogaeae1
- Treatment
- rice straw mulche0
- Outcome
- irrigation watere0
- Direction
- conservede0
- Value
- 21.62%e0
- Qualifier
- I5e0
Not reportedComparator
Organisms pictured · Representative pictures of the matched species, not figures from the paper.
Verbatim
e0“Applying rice straw mulch conserved irrigation water by about 14.37 and 21.62% with I3 and I5 treatments, respectively”
e1“peanut (Arachis hypogaea L.)”
Claim · model-written summary
Peanut WUE ranged from 0.60 under I3M and I5M to 0.36 kg/m3 under I5MO.
- Taxon
- peanutArachis hypogaeae1
- Outcome
- WUEe0
- Value
- 0.36 kg/m3e0
- Qualifier
- 0.60 with I3M and I5Me0
Organisms pictured · Representative pictures of the matched species, not figures from the paper.
Verbatim
e0“WUE ranged from 0.60 with I3M and I5M to 0.36 kg/m3 with I5MO treatment”
e1“peanut (Arachis hypogaea L.)”
Claim · model-written summary
I5M and I3M had maximum IWUE values of 0.48 and 0.47 kg/m3.
Organisms pictured · Representative pictures of the matched species, not figures from the paper.
Verbatim
e0“I5M and I3M treatments had the maximum IWUE values of 0.48 and 0.47 kg/m3, respectively”
e1“peanut (Arachis hypogaea L.)”
Claim · model-written summary
Peanut crop coefficient peaked at 0.88 in July and averaged 0.73 at El-Bustan.
- Taxon
- peanutArachis hypogaeae1
- Outcome
- crop coefficient (KC)e0
- Direction
- maximume0
- Value
- 0.88e0
- Setting
- El-Bustan areae1
Organisms pictured · Representative pictures of the matched species, not figures from the paper.
Verbatim
e0“The maximum crop coefficient (KC) value of 0.88 occurred during July”
e1“the average KC values of peanut at El-Bustan area of 0.73 was close to FAO-33 and-56 listed values”
The same questions in other papers
mulching · yield · Arachis hypogaea (peanut)Results differ
65 papers in the same direction as this paper · 3 in the opposite direction
- positive
- negative
- negative
65 papers more in this group
See all 69 papers →organic · physiology: water · Arachis hypogaea (peanut)Results agree
3 papers in the same direction as this paper
- positive
- positive
- positive
Claims are grouped by organism, treatment and what was measured or targeted. A paper counts as positive when any of its claims in the group is positive.