Abstract
Bananas are susceptible to the highly damaging black Sigatoka disease (BSD) caused by the fungus (Mycosphaerella fijiensis). The objective of this study was to evaluate the effect of leaf pruning frequency on the control of the BSD and the yield of banana. The study was carried out at Njombe (Lat 4º 36’ N, Long 9º 40’ E, 170 m above sea level) in a randomized complete block design with four treatments (3-day, 6-day, 9-day and 12-day pruning frequencies) and three replications. Data were collected on the different stages of evolution of the disease, percentage infection rate, weekly rate of leaf loss, number of leaves at harvest, yields (bunch weight and mid finger circumference and the monetary value of the yields. The results show that the highest maximum percentage rate of infestation of the disease (54.00 % and 50.53 %) was recorded in the 12-day and 9-day frequencies respectively. The lowest weekly rate of leaf loss (0.82 and 0.85 leaves/week) was recorded in the 6-day and 3-day frequencies which differ significantly from 1.90 and 1.38 leaves/week in the 12-day and 9-day frequencies. A statistically significant difference was recorded in the number of leaves at harvest with the highest of 4.20 leaves recorded in the 6-day frequencies. The highest average bunch weight of 32 kg (26.10 %) estimated at 57.36 t/ha was recorded in the 6 day frequency, while 36.8 cm average mid finger circumference was recorded in the 3-day frequency. The 6-day frequency registered the highest monetary value of USD 52,184 /ha, which does not differ significantly from that of the 3-day frequency of USD 52, 021 /ha. The lowest monetary value was recorded in the 12-day frequency of USD 45, 878. From the results of the study, the 6-day pruning frequency could be recommended for practice to accompany the chemical control.
Abstract from the paper’s OpenAlex record; open copy licensed cc-by. Read at the source ↗
The text the model read, with the source record’s inline markup (italics, sub- and superscripts) rendered and its character entities decoded; quote offsets refer to the raw text.
Claims 12
Claim · model-written summary
The 12-day pruning frequency gave the highest maximum black Sigatoka infestation rate (54.00 %) in banana.
- Taxon
- Bananat0
- Treatment
- 12-day pruning frequenciese1
- Interactor
- Mycosphaerella fijiensis
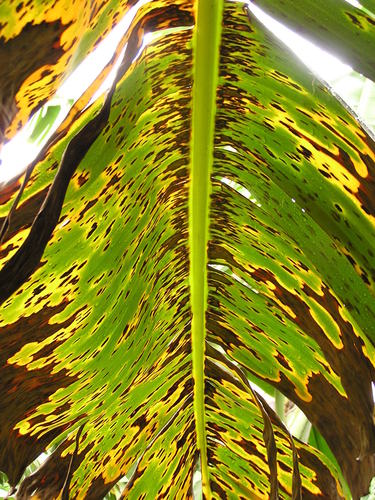
 Pseudocercospora fijiensise0pathogen
- Outcome
- maximum percentage rate of infestation of the diseasee3
- Direction
- higheste3
- Value
- 54.00 %e3
Not reportedComparator
Organisms pictured · Representative pictures of the matched species, not figures from the paper.
Verbatim
e0“Bananas are susceptible to the highly damaging black Sigatoka disease (BSD) caused by the fungus (Mycosphaerella fijiensis)”
e1“in a randomized complete block design with four treatments (3-day, 6-day, 9-day and 12-day pruning frequencies) and three replications. Data were collected on the different stages of evolution of the disease, percentage infection rate, weekly rate of leaf loss, number of leaves at harvest, yields”
e3“The results show that the highest maximum percentage rate of infestation of the disease (54.00 % and 50.53 %) was recorded in the 12-day and 9-day frequencies respectively”
t0“Banana (Musa Spp)”
Claim · model-written summary
The 9-day pruning frequency gave the second-highest maximum black Sigatoka infestation rate (50.53 %) in banana.
- Taxon
- Bananat0
- Treatment
- 9-daye1
- Interactor
- Mycosphaerella fijiensisPseudocercospora fijiensise0pathogen
- Outcome
- maximum percentage rate of infestation of the diseasee3
- Direction
- higheste3
- Value
- 50.53 %e3
Not reportedComparator
Organisms pictured · Representative pictures of the matched species, not figures from the paper.
Verbatim
e0“Bananas are susceptible to the highly damaging black Sigatoka disease (BSD) caused by the fungus (Mycosphaerella fijiensis)”
e1“in a randomized complete block design with four treatments (3-day, 6-day, 9-day and 12-day pruning frequencies) and three replications. Data were collected on the different stages of evolution of the disease, percentage infection rate, weekly rate of leaf loss, number of leaves at harvest, yields”
e3“The results show that the highest maximum percentage rate of infestation of the disease (54.00 % and 50.53 %) was recorded in the 12-day and 9-day frequencies respectively”
t0“Banana (Musa Spp)”
Claim · model-written summary
The 6-day pruning frequency had the lowest weekly leaf loss (0.82 leaves/week) in banana, significantly below the 12-day and 9-day frequencies.
Verbatim
e4“The lowest weekly rate of leaf loss (0.82 and 0.85 leaves/week) was recorded in the 6-day and 3-day frequencies which differ significantly from 1.90 and 1.38 leaves/week in the 12-day and 9-day frequencies”
e1“in a randomized complete block design with four treatments (3-day, 6-day, 9-day and 12-day pruning frequencies) and three replications. Data were collected on the different stages of evolution of the disease, percentage infection rate, weekly rate of leaf loss, number of leaves at harvest, yields”
t0“Banana (Musa Spp)”
Claim · model-written summary
The 3-day pruning frequency had the lowest weekly leaf loss (0.85 leaves/week) in banana, significantly below the 12-day and 9-day frequencies.
Verbatim
e4“The lowest weekly rate of leaf loss (0.82 and 0.85 leaves/week) was recorded in the 6-day and 3-day frequencies which differ significantly from 1.90 and 1.38 leaves/week in the 12-day and 9-day frequencies”
e1“in a randomized complete block design with four treatments (3-day, 6-day, 9-day and 12-day pruning frequencies) and three replications. Data were collected on the different stages of evolution of the disease, percentage infection rate, weekly rate of leaf loss, number of leaves at harvest, yields”
t0“Banana (Musa Spp)”
Claim · model-written summary
The 6-day pruning frequency gave the highest number of leaves at harvest (4.20) in banana, a significant difference.
- Taxon
- Bananat0
- Treatment
- 6-daye1
- Outcome
- number of leaves at harveste5
- Direction
- higheste5
- Value
- 4.20 leavese5
Not reportedComparator
Verbatim
e5“A statistically significant difference was recorded in the number of leaves at harvest with the highest of 4.20 leaves recorded in the 6-day frequencies”
e1“in a randomized complete block design with four treatments (3-day, 6-day, 9-day and 12-day pruning frequencies) and three replications. Data were collected on the different stages of evolution of the disease, percentage infection rate, weekly rate of leaf loss, number of leaves at harvest, yields”
t0“Banana (Musa Spp)”
Claim · model-written summary
The 6-day pruning frequency gave the highest average bunch weight (32 kg) in banana.
- Taxon
- Bananat0
- Treatment
- 6-daye1
- Outcome
- average bunch weighte6
- Direction
- higheste6
- Value
- 32 kge6
- Qualifier
- 26.10 %e6
Not reportedComparator
Verbatim
e6“The highest average bunch weight of 32 kg (26.10 %) estimated at 57.36 t/ha was recorded in the 6 day frequency, while 36.8 cm average mid finger circumference was recorded in the 3-day frequency”
e1“in a randomized complete block design with four treatments (3-day, 6-day, 9-day and 12-day pruning frequencies) and three replications. Data were collected on the different stages of evolution of the disease, percentage infection rate, weekly rate of leaf loss, number of leaves at harvest, yields”
t0“Banana (Musa Spp)”
Claim · model-written summary
The 6-day pruning frequency gave the highest estimated banana yield (57.36 t/ha).
Not reportedComparator
Verbatim
e6“The highest average bunch weight of 32 kg (26.10 %) estimated at 57.36 t/ha was recorded in the 6 day frequency, while 36.8 cm average mid finger circumference was recorded in the 3-day frequency”
e1“in a randomized complete block design with four treatments (3-day, 6-day, 9-day and 12-day pruning frequencies) and three replications. Data were collected on the different stages of evolution of the disease, percentage infection rate, weekly rate of leaf loss, number of leaves at harvest, yields”
t0“Banana (Musa Spp)”
Claim · model-written summary
The 3-day pruning frequency gave the highest average mid finger circumference (36.8 cm) in banana.
- Taxon
- Bananat0
- Treatment
- 3-daye1
- Outcome
- average mid finger circumferencee6
- Direction
- higherinferrede6
- Value
- 36.8 cme6
Not reportedComparator
Verbatim
e6“The highest average bunch weight of 32 kg (26.10 %) estimated at 57.36 t/ha was recorded in the 6 day frequency, while 36.8 cm average mid finger circumference was recorded in the 3-day frequency”
e1“in a randomized complete block design with four treatments (3-day, 6-day, 9-day and 12-day pruning frequencies) and three replications. Data were collected on the different stages of evolution of the disease, percentage infection rate, weekly rate of leaf loss, number of leaves at harvest, yields”
t0“Banana (Musa Spp)”
Claim · model-written summary
The 6-day pruning frequency gave the highest monetary value (USD 52,184 /ha) in banana.
Not reportedComparator
Verbatim
e7“The 6-day frequency registered the highest monetary value of USD 52,184 /ha, which does not differ significantly from that of the 3-day frequency of USD 52, 021 /ha. The lowest monetary value was recorded in the 12-day frequency of USD 45, 878”
e1“in a randomized complete block design with four treatments (3-day, 6-day, 9-day and 12-day pruning frequencies) and three replications. Data were collected on the different stages of evolution of the disease, percentage infection rate, weekly rate of leaf loss, number of leaves at harvest, yields”
t0“Banana (Musa Spp)”
Claim · model-written summary
The monetary value of the 6-day pruning frequency did not differ significantly from the 3-day frequency (USD 52, 021 /ha).
Verbatim
e7“The 6-day frequency registered the highest monetary value of USD 52,184 /ha, which does not differ significantly from that of the 3-day frequency of USD 52, 021 /ha. The lowest monetary value was recorded in the 12-day frequency of USD 45, 878”
e1“in a randomized complete block design with four treatments (3-day, 6-day, 9-day and 12-day pruning frequencies) and three replications. Data were collected on the different stages of evolution of the disease, percentage infection rate, weekly rate of leaf loss, number of leaves at harvest, yields”
t0“Banana (Musa Spp)”
Claim · model-written summary
The 12-day pruning frequency gave the lowest monetary value (USD 45, 878 /ha) in banana.
Not reportedComparator
Verbatim
e7“The 6-day frequency registered the highest monetary value of USD 52,184 /ha, which does not differ significantly from that of the 3-day frequency of USD 52, 021 /ha. The lowest monetary value was recorded in the 12-day frequency of USD 45, 878”
t0“Banana (Musa Spp)”
Claim · model-written summary
The authors recommend the 6-day pruning frequency for banana practice to accompany chemical control.
Verbatim
e2“From the results of the study, the 6-day pruning frequency could be recommended for practice to accompany the chemical control”
t0“Banana (Musa Spp)”
The same questions in other papers
pruning · Pseudocercospora fijiensis · MusaPositive and negative results
1 in the opposite direction
- positive
Claims are grouped by organism, treatment and what was measured or targeted. A paper counts as positive when any of its claims in the group is positive.