Abstract
Abstract Population growth in many tropical areas has led to the cultivation of steeply sloped hillsides. Soil disturbance from construction of conservation terraces to reduce land degradation in humid tropical areas often intensifies P deficiency and problems related to acidity. This trial measured the response of food crops to lime and P application for 2.5 yr following construction of bench terraces. Factorial combinations of 0, 2, and 4 Mg ha −1 lime and 0, 10, 20 and 40 kg P ha −1 were applied on a deep, well‐drained clay of volcanic origin (Typic Haplumbrept) at Andapraja, West Java, Indonesia. A pretrial soil test indicated pH of 5.0, available P (Bray 1) of 5.9 mg kg −1 and exchangeable Al saturation of 17%. Upland rice ( Oryza sativa L.) responded strongly to P application. Three crops averaged 0.35, 2.45, 2.89 and 3.46 Mg ha − of unmilled grain from respective applications of 0, 10, 20 and 40 kg P ha −1 . Lime had no effect on rice yield. Soybean [ Glycine max (L.) Merr.] and cowpea [ Vigna unguiculata (L.) Walp.] responded to both lime and P but yields were low because of disease. Mean lime and no‐lime yields were 0.48 and 0.62 Mg ha −1 for soybean. Cowpea yields were maximum (0.15 Mg ha −1 ) at the 2 Mg ha −1 lime rate. Mean P and no‐P yields were 0.13 and 0.64 Mg ha −1 for soybean and 0.01 and 0.13 Mg ha −1 for cowpea. Cassava ( Manihot esculenta Crantz) root yield response to P was less pronounced than the response by rice and the legumes, and was the only crop to show a lime ✕ P interaction. This was attributed to limited response to P when lime was applied, significant response to P with zero lime and marked response to lime with zero P. The efficiency of return from applied P indicated that the 10 kg P ha −1 rate applied to rice, soybean or cassava had the highest efficiency, producing yields 70 to 80% of the 40 kg P ha −1 rate.
Abstract from the paper’s OpenAlex record, shown for indexing and research. Copyright remains with the authors or the publisher. Read at the source ↗
The text the model read, with the source record’s inline markup (italics, sub- and superscripts) rendered and its character entities decoded; quote offsets refer to the raw text.
Claims 20
Claim · model-written summary
Upland rice responded strongly to P application.
- Taxon
- Upland rice
 Oryza sativae1
- Treatment
- P applicatione1
- Outcome
- responded stronglye1
- Direction
- responded stronglye1
Not reportedComparator
Organisms pictured · Representative pictures of the matched species, not figures from the paper.

Verbatim
e1“Upland rice ( Oryza sativa L.) responded strongly to P application”
Claim · model-written summary
Upland rice averaged 0.35 Mg/ha unmilled grain at 0 kg P/ha (three-crop mean).
- Taxon
- Upland riceOryza sativae1
- Treatment
- P applicatione1
- Outcome
- unmilled graine2
- Value
- 0.35e2
Organisms pictured · Representative pictures of the matched species, not figures from the paper.
Verbatim
e1“Upland rice ( Oryza sativa L.) responded strongly to P application”
e2“Three crops averaged 0.35, 2.45, 2.89 and 3.46 Mg ha − of unmilled grain from respective applications of 0, 10, 20 and 40 kg P ha −1”
Claim · model-written summary
Upland rice averaged 2.45 Mg/ha unmilled grain at 10 kg P/ha (three-crop mean).
- Taxon
- Upland riceOryza sativae1
- Treatment
- P applicatione1
- Outcome
- unmilled graine2
- Value
- 2.45e2
Organisms pictured · Representative pictures of the matched species, not figures from the paper.
Verbatim
e1“Upland rice ( Oryza sativa L.) responded strongly to P application”
e2“Three crops averaged 0.35, 2.45, 2.89 and 3.46 Mg ha − of unmilled grain from respective applications of 0, 10, 20 and 40 kg P ha −1”
Claim · model-written summary
Upland rice averaged 2.89 Mg/ha unmilled grain at 20 kg P/ha (three-crop mean).
- Taxon
- Upland riceOryza sativae1
- Treatment
- P applicatione1
- Outcome
- unmilled graine2
- Value
- 2.89e2
Organisms pictured · Representative pictures of the matched species, not figures from the paper.
Verbatim
e1“Upland rice ( Oryza sativa L.) responded strongly to P application”
e2“Three crops averaged 0.35, 2.45, 2.89 and 3.46 Mg ha − of unmilled grain from respective applications of 0, 10, 20 and 40 kg P ha −1”
Claim · model-written summary
Upland rice averaged 3.46 Mg/ha unmilled grain at 40 kg P/ha (three-crop mean).
- Taxon
- Upland riceOryza sativae1
- Treatment
- P applicatione1
- Outcome
- unmilled graine2
- Value
- 3.46e2
Organisms pictured · Representative pictures of the matched species, not figures from the paper.
Verbatim
e1“Upland rice ( Oryza sativa L.) responded strongly to P application”
e2“Three crops averaged 0.35, 2.45, 2.89 and 3.46 Mg ha − of unmilled grain from respective applications of 0, 10, 20 and 40 kg P ha −1”
Claim · model-written summary
Lime had no effect on rice yield.
- Taxon
- riceOryza sativae3
- Treatment
- Limee3
- Outcome
- yielde3
- Direction
- no effecte3
Not reportedComparator
Organisms pictured · Representative pictures of the matched species, not figures from the paper.
Verbatim
e3“Lime had no effect on rice yield”
Claim · model-written summary
Soybean responded to lime and P, but its yields were low because of disease.
- Taxon
- Soybean
 Glycine maxe4
- Treatment
- lime and Pe4
- Outcome
- yieldse4
- Direction
- lowe4
- Qualifier
- because of diseasee4
Not reportedComparator
Organisms pictured · Representative pictures of the matched species, not figures from the paper.

Verbatim
e4“Soybean [ Glycine max (L.) Merr.] and cowpea [ Vigna unguiculata (L.) Walp.] responded to both lime and P but yields were low because of disease”
Claim · model-written summary
Cowpea responded to lime and P, but its yields were low because of disease.
- Taxon
- cowpea
 Vigna unguiculatae4
- Treatment
- lime and Pe4
- Outcome
- yieldse4
- Direction
- lowe4
- Qualifier
- because of diseasee4
Not reportedComparator
Organisms pictured · Representative pictures of the matched species, not figures from the paper.

Verbatim
e4“Soybean [ Glycine max (L.) Merr.] and cowpea [ Vigna unguiculata (L.) Walp.] responded to both lime and P but yields were low because of disease”
Claim · model-written summary
Soybean yield with lime was 0.48 Mg/ha, lower than 0.62 Mg/ha without lime.
- Taxon
- soybeanGlycine maxe5
- Treatment
- limee5
- Outcome
- yieldse5
- Direction
- lowerinferrede5
- Value
- 0.48 and 0.62e5
- Comparator
- no‐limee5
Organisms pictured · Representative pictures of the matched species, not figures from the paper.
Verbatim
e5“Mean lime and no‐lime yields were 0.48 and 0.62 Mg ha −1 for soybean”
Claim · model-written summary
Soybean yield with P was 0.13 Mg/ha, against 0.64 Mg/ha without P, as written.
- Taxon
- soybeanGlycine maxe6
- Treatment
- Pe6
- Outcome
- yieldse6
- Direction
- lowerinferrede6
- Value
- 0.13 and 0.64e6
- Comparator
- no‐Pe6
Organisms pictured · Representative pictures of the matched species, not figures from the paper.
Verbatim
e6“Mean P and no‐P yields were 0.13 and 0.64 Mg ha −1 for soybean and 0.01 and 0.13 Mg ha −1 for cowpea”
Claim · model-written summary
Cowpea yield was maximum (0.15 Mg/ha) at the 2 Mg/ha lime rate.
- Taxon
- CowpeaVigna unguiculatae7
- Treatment
- limee7
- Outcome
- yieldse7
- Direction
- maximume7
- Value
- 0.15e7
- Qualifier
- at the 2 Mg ha −1 lime ratee7
Not reportedComparator
Organisms pictured · Representative pictures of the matched species, not figures from the paper.
Verbatim
e7“Cowpea yields were maximum (0.15 Mg ha −1) at the 2 Mg ha −1 lime rate”
Claim · model-written summary
Cowpea yield with P was 0.01 Mg/ha, against 0.13 Mg/ha without P, as written.
- Taxon
- cowpeaVigna unguiculatae6
- Treatment
- Pe6
- Outcome
- yieldse6
- Direction
- lowerinferrede6
- Value
- 0.01 and 0.13e6
- Comparator
- no‐Pe6
Organisms pictured · Representative pictures of the matched species, not figures from the paper.
Verbatim
e6“Mean P and no‐P yields were 0.13 and 0.64 Mg ha −1 for soybean and 0.01 and 0.13 Mg ha −1 for cowpea”
Claim · model-written summary
The cassava root yield response to P was less pronounced than the response of rice and the legumes.
- Taxon
- Cassava
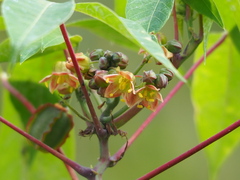 Manihot esculentae1
- Treatment
- Pe1
- Outcome
- root yield response to Pe1
- Direction
- less pronouncede1
- Comparator
- rice and the legumese1
Organisms pictured · Representative pictures of the matched species, not figures from the paper.
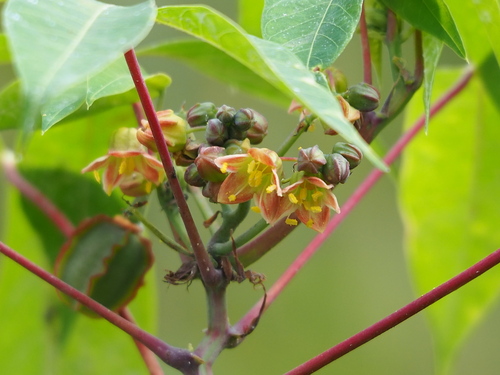
Verbatim
e1“Cassava ( Manihot esculenta Crantz) root yield response to P was less pronounced than the response by rice and the legumes, and was the only crop to show a lime ✕ P interaction”
Claim · model-written summary
Cassava was the only crop to show a lime × P interaction.
- Taxon
- CassavaManihot esculentae1
- Treatment
- limee1
- Outcome
- lime ✕ P interactione1
Organisms pictured · Representative pictures of the matched species, not figures from the paper.
Verbatim
e1“Cassava ( Manihot esculenta Crantz) root yield response to P was less pronounced than the response by rice and the legumes, and was the only crop to show a lime ✕ P interaction”
Claim · model-written summary
Cassava showed a limited response to P when lime was applied.
- Taxon
- CassavaManihot esculentae1
- Treatment
- limee2
- Outcome
- response to Pe2
- Qualifier
- when lime was appliede2
Organisms pictured · Representative pictures of the matched species, not figures from the paper.
Verbatim
e1“Cassava ( Manihot esculenta Crantz) root yield response to P was less pronounced than the response by rice and the legumes, and was the only crop to show a lime ✕ P interaction”
e2“This was attributed to limited response to P when lime was applied, significant response to P with zero lime and marked response to lime with zero P”
Claim · model-written summary
Cassava showed a significant response to P with zero lime.
- Taxon
- CassavaManihot esculentae1
- Treatment
- Pe2
- Outcome
- response to Pe2
- Qualifier
- with zero limee2
Organisms pictured · Representative pictures of the matched species, not figures from the paper.
Verbatim
e1“Cassava ( Manihot esculenta Crantz) root yield response to P was less pronounced than the response by rice and the legumes, and was the only crop to show a lime ✕ P interaction”
e2“This was attributed to limited response to P when lime was applied, significant response to P with zero lime and marked response to lime with zero P”
Claim · model-written summary
Cassava showed a marked response to lime with zero P.
- Taxon
- CassavaManihot esculentae1
- Treatment
- limee2
- Outcome
- response to limee2
- Qualifier
- with zero Pe2
Organisms pictured · Representative pictures of the matched species, not figures from the paper.
Verbatim
e1“Cassava ( Manihot esculenta Crantz) root yield response to P was less pronounced than the response by rice and the legumes, and was the only crop to show a lime ✕ P interaction”
e2“This was attributed to limited response to P when lime was applied, significant response to P with zero lime and marked response to lime with zero P”
Claim · model-written summary
Rice gave the highest efficiency at 10 kg P/ha, with yields 70 to 80% of the 40 kg P/ha rate.
- Taxon
- riceOryza sativae0
- Treatment
- 10 kg P ha −1 ratee0
- Outcome
- efficiencye0
- Direction
- higheste0
- Value
- 70 to 80%e0
- Comparator
- 40 kg P ha −1 ratee0
Organisms pictured · Representative pictures of the matched species, not figures from the paper.
Verbatim
e0“The efficiency of return from applied P indicated that the 10 kg P ha −1 rate applied to rice, soybean or cassava had the highest efficiency, producing yields 70 to 80% of the 40 kg P ha −1 rate”
Claim · model-written summary
Soybean gave the highest efficiency at 10 kg P/ha, with yields 70 to 80% of the 40 kg P/ha rate.
- Taxon
- soybeanGlycine maxe0
- Treatment
- 10 kg P ha −1 ratee0
- Outcome
- efficiencye0
- Direction
- higheste0
- Value
- 70 to 80%e0
- Comparator
- 40 kg P ha −1 ratee0
Organisms pictured · Representative pictures of the matched species, not figures from the paper.
Verbatim
e0“The efficiency of return from applied P indicated that the 10 kg P ha −1 rate applied to rice, soybean or cassava had the highest efficiency, producing yields 70 to 80% of the 40 kg P ha −1 rate”
Claim · model-written summary
Cassava gave the highest efficiency at 10 kg P/ha, with yields 70 to 80% of the 40 kg P/ha rate.
- Taxon
- cassavaManihot esculentae0
- Treatment
- 10 kg P ha −1 ratee0
- Outcome
- efficiencye0
- Direction
- higheste0
- Value
- 70 to 80%e0
- Comparator
- 40 kg P ha −1 ratee0
Organisms pictured · Representative pictures of the matched species, not figures from the paper.
Verbatim
e0“The efficiency of return from applied P indicated that the 10 kg P ha −1 rate applied to rice, soybean or cassava had the highest efficiency, producing yields 70 to 80% of the 40 kg P ha −1 rate”
The same questions in other papers
phosphorus · yield · Vigna unguiculata (cowpea)Results differ
5 papers in the same direction as this paper · 107 in the opposite direction
- positive
- positive
- positive
109 papers more in this group
See all 113 papers →lime · yield · Oryza sativa (rice)Results differ
12 papers in the same direction as this paper · 123 in the opposite direction
- positive
- positive
- positive
132 papers more in this group
See all 136 papers →lime · yield · Vigna unguiculata (cowpea)Positive and negative results
13 papers in the same direction as this paper · 3 in the opposite direction
- no effect
- negative
- no effect
13 papers more in this group
See all 17 papers →phosphorus · yield · Manihot esculenta (cassava)Positive and negative results
1 paper in the same direction as this paper · 18 in the opposite direction
- positive
- positive
- positive
16 papers more in this group
See all 20 papers →lime · yield · Glycine max (soybean)Positive and negative results
32 papers in the same direction as this paper · 108 in the opposite direction
- positive
- positive
- positive
137 papers more in this group
See all 141 papers →phosphorus · yield · Glycine max (soybean)Positive and negative results
51 papers in the same direction as this paper · 303 in the opposite direction
- positive
- positive
- positive
351 papers more in this group
See all 355 papers →Claims are grouped by organism, treatment and what was measured or targeted. A paper counts as positive when any of its claims in the group is positive.