Abstract
Peanuts were exposed during 1979 and 1980 to concentrations of ozone (O/sub 3/) that spanned those that occur in ambient air of peanut production areas in the United States. The different concentrations were obtained by adding O/sub 3/ to the air of open-top field chambers for 7 hr per day from the seedling stage to harvest. Ozone at seasonal 7-hr per day concentrations (mean concentration for 7 hr per day during the seasonal exposure period) equal to, or greater than, the ambient concentration caused foliar injury and decreased shoot and root weight for both years. Seasonal 7-hr per day O/sub 3/ concentrations in ambient air at the field site near Raleigh, NC, were 0.052 and 0.056 ppM for 1979 (131 days) and 1980 (112 days), respectively. In 1979, marketable pod weight (yield) per plant at seasonal 7-hr per day O/sub 3/ concentrations of 0.049, 0.072, and 0.096 ppM was 0, 30, and 37% less, respectively, than for control plants in chambers that received charcoal-filtered air with a seasonal concentration of 0.026 ppM O/sub 3/. In 1980, yield at seasonal O/sub 3/ concentrations of 0.056, 0.076, 0.100, and 0.125 ppM was 14, 35, 52, and 72% less, respectively, than for themore » control treatment (0.025 ppM). Linear regression equations using data from 1979 and 1980 predicted yield losses of 17 and 21%, respectively, at a seasonal 7-hr per day mean O/sub 3/ concentration of 0.054 ppM. 13 references, 4 figures, 2 tables.« less
Abstract from the paper’s OpenAlex record; open copy licensed public-domain. Read at the source ↗
The text the model read, with the source record’s inline markup (italics, sub- and superscripts) rendered and its character entities decoded; quote offsets refer to the raw text.
Claims 11
Claim · model-written summary
Seasonal ozone concentrations equal to or greater than ambient caused foliar injury in peanuts.
- Taxon
- Peanuts
 Arachis hypogaeae1
- Treatment
- Ozone at seasonal 7-hr per day concentrationse2
- Outcome
- foliar injurye2
- Comparator
- the ambient concentratione2
Not reportedDirection
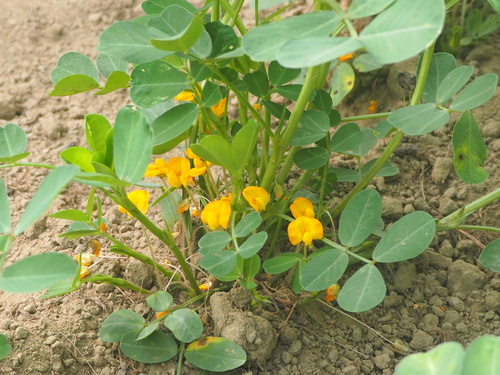
Organisms pictured · Representative pictures of the matched species, not figures from the paper.
Verbatim
e1“Peanuts were exposed during 1979 and 1980”
e2“Ozone at seasonal 7-hr per day concentrations (mean concentration for 7 hr per day during the seasonal exposure period) equal to, or greater than, the ambient concentration caused foliar injury and decreased shoot and root weight for both years”
Claim · model-written summary
Seasonal ozone concentrations equal to or greater than ambient decreased shoot and root weight of peanuts for both years.
- Taxon
- PeanutsArachis hypogaeae1
- Treatment
- Ozone at seasonal 7-hr per day concentrationse2
- Outcome
- shoot and root weighte2
- Direction
- decreasede2
- Qualifier
- for both yearse2
- Comparator
- the ambient concentratione2
Organisms pictured · Representative pictures of the matched species, not figures from the paper.
Verbatim
e1“Peanuts were exposed during 1979 and 1980”
e2“Ozone at seasonal 7-hr per day concentrations (mean concentration for 7 hr per day during the seasonal exposure period) equal to, or greater than, the ambient concentration caused foliar injury and decreased shoot and root weight for both years”
Claim · model-written summary
In 1979, marketable pod weight at seasonal 7-hr O3 of 0.049 ppM was not reduced relative to control plants.
- Taxon
- PeanutsArachis hypogaeae1
- Treatment
- seasonal 7-hr per day O/sub 3/ concentrationse5
- Outcome
- marketable pod weight (yield) per plante5
- Direction
- lesse5
- Value
- 0e5
- Qualifier
- 0.049e5
- Comparator
- control plants in chambers that received charcoal-filtered aire5
Organisms pictured · Representative pictures of the matched species, not figures from the paper.
Verbatim
e1“Peanuts were exposed during 1979 and 1980”
e5“In 1979, marketable pod weight (yield) per plant at seasonal 7-hr per day O/sub 3/ concentrations of 0.049, 0.072, and 0.096 ppM was 0, 30, and 37% less, respectively, than for control plants in chambers that received charcoal-filtered air with a seasonal concentration of 0.026 ppM O/sub 3/”
Claim · model-written summary
In 1979, marketable pod weight at seasonal 7-hr O3 of 0.072 ppM was 30% less than control plants.
- Taxon
- PeanutsArachis hypogaeae1
- Treatment
- seasonal 7-hr per day O/sub 3/ concentrationse5
- Outcome
- marketable pod weight (yield) per plante5
- Direction
- lesse5
- Value
- 30e5
- Qualifier
- 0.072e5
- Comparator
- control plants in chambers that received charcoal-filtered aire5
Organisms pictured · Representative pictures of the matched species, not figures from the paper.
Verbatim
e1“Peanuts were exposed during 1979 and 1980”
e5“In 1979, marketable pod weight (yield) per plant at seasonal 7-hr per day O/sub 3/ concentrations of 0.049, 0.072, and 0.096 ppM was 0, 30, and 37% less, respectively, than for control plants in chambers that received charcoal-filtered air with a seasonal concentration of 0.026 ppM O/sub 3/”
Claim · model-written summary
In 1979, marketable pod weight at seasonal 7-hr O3 of 0.096 ppM was 37% less than control plants.
- Taxon
- PeanutsArachis hypogaeae1
- Treatment
- seasonal 7-hr per day O/sub 3/ concentrationse5
- Outcome
- marketable pod weight (yield) per plante5
- Direction
- lesse5
- Value
- 37%e5
- Qualifier
- 0.096e5
- Comparator
- control plants in chambers that received charcoal-filtered aire5
Organisms pictured · Representative pictures of the matched species, not figures from the paper.
Verbatim
e1“Peanuts were exposed during 1979 and 1980”
e5“In 1979, marketable pod weight (yield) per plant at seasonal 7-hr per day O/sub 3/ concentrations of 0.049, 0.072, and 0.096 ppM was 0, 30, and 37% less, respectively, than for control plants in chambers that received charcoal-filtered air with a seasonal concentration of 0.026 ppM O/sub 3/”
Claim · model-written summary
In 1980, yield at seasonal O3 of 0.056 ppM was 14% less than the control treatment.
- Taxon
- PeanutsArachis hypogaeae1
- Treatment
- seasonal O/sub 3/ concentrationse6
- Outcome
- yielde6
- Direction
- lesse6
- Value
- 14e6
- Qualifier
- 0.056e6
- Comparator
- control treatmente7
Organisms pictured · Representative pictures of the matched species, not figures from the paper.
Verbatim
e1“Peanuts were exposed during 1979 and 1980”
e6“In 1980, yield at seasonal O/sub 3/ concentrations of 0.056, 0.076, 0.100, and 0.125 ppM was 14, 35, 52, and 72% less, respectively”
e7“control treatment (0.025 ppM)”
Claim · model-written summary
In 1980, yield at seasonal O3 of 0.076 ppM was 35% less than the control treatment.
- Taxon
- PeanutsArachis hypogaeae1
- Treatment
- seasonal O/sub 3/ concentrationse6
- Outcome
- yielde6
- Direction
- lesse6
- Value
- 35e6
- Qualifier
- 0.076e6
- Comparator
- control treatmente7
Organisms pictured · Representative pictures of the matched species, not figures from the paper.
Verbatim
e1“Peanuts were exposed during 1979 and 1980”
e6“In 1980, yield at seasonal O/sub 3/ concentrations of 0.056, 0.076, 0.100, and 0.125 ppM was 14, 35, 52, and 72% less, respectively”
e7“control treatment (0.025 ppM)”
Claim · model-written summary
In 1980, yield at seasonal O3 of 0.100 ppM was 52% less than the control treatment.
- Taxon
- PeanutsArachis hypogaeae1
- Treatment
- seasonal O/sub 3/ concentrationse6
- Outcome
- yielde6
- Direction
- lesse6
- Value
- 52e6
- Qualifier
- 0.100e6
- Comparator
- control treatmente7
Organisms pictured · Representative pictures of the matched species, not figures from the paper.
Verbatim
e1“Peanuts were exposed during 1979 and 1980”
e6“In 1980, yield at seasonal O/sub 3/ concentrations of 0.056, 0.076, 0.100, and 0.125 ppM was 14, 35, 52, and 72% less, respectively”
e7“control treatment (0.025 ppM)”
Claim · model-written summary
In 1980, yield at seasonal O3 of 0.125 ppM was 72% less than the control treatment.
- Taxon
- PeanutsArachis hypogaeae1
- Treatment
- seasonal O/sub 3/ concentrationse6
- Outcome
- yielde6
- Direction
- lesse6
- Value
- 72%e6
- Qualifier
- 0.125e6
- Comparator
- control treatmente7
Organisms pictured · Representative pictures of the matched species, not figures from the paper.
Verbatim
e1“Peanuts were exposed during 1979 and 1980”
e6“In 1980, yield at seasonal O/sub 3/ concentrations of 0.056, 0.076, 0.100, and 0.125 ppM was 14, 35, 52, and 72% less, respectively”
e7“control treatment (0.025 ppM)”
Claim · model-written summary
Regression on 1979 data predicted a 17% yield loss at a seasonal 7-hr mean O3 of 0.054 ppM.
- Taxon
- PeanutsArachis hypogaeae1
- Treatment
- seasonal 7-hr per day mean O/sub 3/ concentratione3
- Outcome
- yield lossese3
- Direction
- decreaseinferrede3
- Value
- 17e3
- Qualifier
- 0.054e3
Organisms pictured · Representative pictures of the matched species, not figures from the paper.
Verbatim
e1“Peanuts were exposed during 1979 and 1980”
e3“Linear regression equations using data from 1979 and 1980 predicted yield losses of 17 and 21%, respectively, at a seasonal 7-hr per day mean O/sub 3/ concentration of 0.054 ppM”
Claim · model-written summary
Regression on 1980 data predicted a 21% yield loss at a seasonal 7-hr mean O3 of 0.054 ppM.
- Taxon
- PeanutsArachis hypogaeae1
- Treatment
- seasonal 7-hr per day mean O/sub 3/ concentratione3
- Outcome
- yield lossese3
- Direction
- decreaseinferrede3
- Value
- 21%e3
- Qualifier
- 0.054e3
Organisms pictured · Representative pictures of the matched species, not figures from the paper.
Verbatim
e1“Peanuts were exposed during 1979 and 1980”
e3“Linear regression equations using data from 1979 and 1980 predicted yield losses of 17 and 21%, respectively, at a seasonal 7-hr per day mean O/sub 3/ concentration of 0.054 ppM”
The same questions in other papers
ozone · crop injury · Arachis hypogaea (peanut)Positive and negative results
1 in the opposite direction
- positive
ozone · growth · Arachis hypogaea (peanut)Results agree
1 paper in the same direction as this paper
- negative
Claims are grouped by organism, treatment and what was measured or targeted. A paper counts as positive when any of its claims in the group is positive.