Abstract
Climate-variability and change can immensely affect the agricultural productivity of India. To study the impacts and vulnerability of climate change on Indian agriculture, and developing suitable adaptation strategies, a network project on climate change (NPCC) under the aegis of the Indian Council of Agricultural Research was initiated at 15 research centers during X plan period and the project further expanded in XI plan with additional centre totally to 23 at present. Central Research Institute for Dryland Agriculture (CRIDA) is one among them to work on climate change on rainfed agriculture. The research programme assigned to CRIDA are 1) Agro-climatic trend analysis 2) Impacts of elevated CO2 on crops, pests and diseases 3) Water resources 4) Soil organic pools 5) Agro forests potentials for combating climatic change. Long term climatic data base have revealed that the temperature regimes in general have shown an upward trend, while the precipitation has reduced considerably in central and eastern parts of the Country. Shifts in rainfall peaks, drought probability and crop water requirements are some studies attempted under this programme. The experiments on impacts of elevated CO2 on crops showed an increment in total biomass by 46% in C3 pulses and 29% in oilseeds at vegetative stage with elevated CO2 (600ppm), whereas with C4 cereals it was only 15%. Elevated CO2 levels also significantly reduced the duration of “days to initiation of flowering” and increased the number of female flowers in the spike of castor crop and thereby improving the seed yield. Oil content in groundnut showed an incremental trend from 45.3% at ambient control to 45.7% at 550ppm and 47.7% at 700ppm revealing its influence on improvement in the oil content percentage. Seed protein of groundnut recorded 28.5% at 370ppm showed no change at elevated CO2. Larvae of A. janata and S.litura consumed slowly on elevated CO2 foliage as noticed by lower coefficients with an increase of two days larval duration than those of chamber and open ambient. Changes in A. janata and S.litura growth rates can be attributed to variation in food processing efficiencies. Preliminary observations on pathogens suggest that sporulation increased in Trichoderma viride under elevated CO2, however, the growth was 15–20% slow at 15th generation when compared to the 1st generation. However, the bioefficacy of the strains in terms of competition for substrate remained unaltered up to 15th generation. All the PGPR traits of Pseudomonas were reduced at elevated CO2 conditions. Using Had CM3 projected scenarios, in Andhra Pradesh, sorghum yields reduced by 8%, 18% and 30% by 2020, 2050 and 2080, respectively, for Anantapur where as for Palem the reductions were only 2.2% 5.1% and 9.7% in the years 2020, 2050 and 2080, respectively. Impacts of climate –change and –variability on soil and water resources have also been initiated.
Abstract from the paper’s OpenAlex record, shown for indexing and research. Copyright remains with the authors or the publisher. Read at the source ↗
The text the model read, with the source record’s inline markup (italics, sub- and superscripts) rendered and its character entities decoded; quote offsets refer to the raw text.
Claims 19
Claim · model-written summary
Elevated CO2 increased vegetative biomass in C3 pulses by 46%.
- Taxon
- C3 pulsese0
- Treatment
- elevated CO2 (600ppm)e1
- Outcome
- total biomasse0
- Direction
- incremente0
- Value
- 46%e0
Not reportedComparator
Verbatim
e0“increment in total biomass by 46% in C3 pulses”
e1“with elevated CO2 (600ppm)”
Claim · model-written summary
Elevated CO2 increased vegetative biomass in oilseeds by 29%.
- Taxon
- oilseedse0
- Treatment
- elevated CO2 (600ppm)e0
- Outcome
- oilseeds at vegetative stagee0
- Direction
- increaseinferrede0
- Value
- 29%e0
Not reportedComparator
Verbatim
e0“29% in oilseeds at vegetative stage with elevated CO2 (600ppm)”
Claim · model-written summary
Elevated CO2 increased biomass in C4 cereals by 15%.
- Taxon
- C4 cerealse0
- Treatment
- elevated CO2 (600ppm)e2
- Outcome
- total biomasse1
- Direction
- incremente1
- Value
- 15%e0
Not reportedComparator
Verbatim
e0“whereas with C4 cereals it was only 15%”
e1“increment in total biomass”
e2“with elevated CO2 (600ppm)”
Claim · model-written summary
Elevated CO2 significantly shortened time to flowering initiation in castor.
- Taxon
- castor
 Ricinus communise1
- Treatment
- Elevated CO2 levelse0
- Outcome
- duration of “days to initiation of flowering”e0
- Direction
- reducede0
Not reportedComparator
Organisms pictured · Representative pictures of the matched species, not figures from the paper.

Verbatim
e0“Elevated CO2 levels also significantly reduced the duration of “days to initiation of flowering””
e1“castor crop”
Claim · model-written summary
Elevated CO2 increased female flower number in castor spikes.
- Taxon
- castor cropRicinus communise0
- Organ / stage
- spikee0
- Treatment
- Elevated CO2 levelse1
- Outcome
- number of female flowerse0
- Direction
- increasede0
Not reportedComparator
Organisms pictured · Representative pictures of the matched species, not figures from the paper.
Verbatim
e0“increased the number of female flowers in the spike of castor crop”
e1“Elevated CO2 levels”
Claim · model-written summary
Elevated CO2 improved castor seed yield.
- Taxon
- castor cropRicinus communise1
- Treatment
- Elevated CO2 levelse2
- Outcome
- seed yielde0
- Direction
- improvinge0
Not reportedComparator
Organisms pictured · Representative pictures of the matched species, not figures from the paper.
Verbatim
e0“thereby improving the seed yield”
e1“castor crop”
e2“Elevated CO2 levels”
Claim · model-written summary
Groundnut oil content rose to 45.7% at 550ppm CO2 from 45.3% under ambient control.
- Taxon
- groundnut
 Arachis hypogaeae0
- Treatment
- 550ppme0
- Outcome
- Oil contente0
- Direction
- incremental trende0
- Value
- 45.7%e0
- Qualifier
- 45.3%e0
- Comparator
- ambient controle0
Organisms pictured · Representative pictures of the matched species, not figures from the paper.
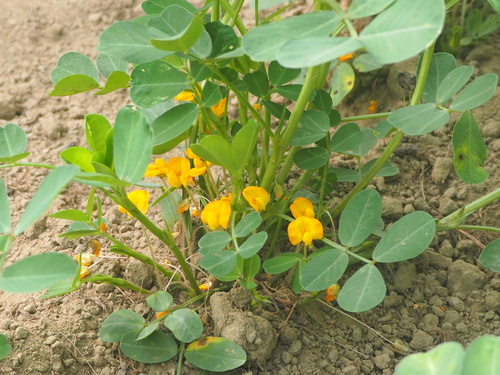
Verbatim
e0“Oil content in groundnut showed an incremental trend from 45.3% at ambient control to 45.7% at 550ppm”
Claim · model-written summary
Groundnut oil content rose to 47.7% at 700ppm CO2 from 45.3% under ambient control.
- Taxon
- groundnutArachis hypogaeae0
- Treatment
- 700ppme0
- Outcome
- Oil contente0
- Direction
- incremental trende0
- Value
- 47.7%e0
- Qualifier
- 45.3%e0
- Comparator
- ambient controle0
Organisms pictured · Representative pictures of the matched species, not figures from the paper.
Verbatim
e0“Oil content in groundnut showed an incremental trend from 45.3% at ambient control to 45.7% at 550ppm and 47.7% at 700ppm”
Claim · model-written summary
Groundnut seed protein showed no change under elevated CO2 relative to 28.5% at 370ppm.
- Taxon
- groundnutArachis hypogaeae0
- Treatment
- elevated CO2e0
- Outcome
- Seed proteine0
- Direction
- no changee0
- Value
- 28.5%e0
- Comparator
- 370ppme0
Organisms pictured · Representative pictures of the matched species, not figures from the paper.
Verbatim
e0“Seed protein of groundnut recorded 28.5% at 370ppm showed no change at elevated CO2”
Claim · model-written summary
Larval feeding on elevated CO2 foliage was slower for A. janata.
- Taxon
- foliagee0
- Treatment
- elevated CO2e0
- Interactor
- A. janatae0pest
- Outcome
- consumed slowlye0
- Direction
- lowere0
Not reportedComparator
Verbatim
e0“Larvae of A. janata and S.litura consumed slowly on elevated CO2 foliage as noticed by lower coefficients”
Claim · model-written summary
Larval feeding on elevated CO2 foliage was slower for S.litura.
- Taxon
- foliagee0
- Treatment
- elevated CO2e0
- Interactor
- S.liturae0pest
- Outcome
- S.litura consumed slowlye0
- Direction
- lowere0
Not reportedComparator
Verbatim
e0“Larvae of A. janata and S.litura consumed slowly on elevated CO2 foliage as noticed by lower coefficients”
Claim · model-written summary
A. janata larval duration was two days longer on elevated CO2 foliage.
Verbatim
e0“Larvae of A. janata and S.litura consumed slowly on elevated CO2 foliage as noticed by lower coefficients with an increase of two days larval duration than those of chamber and open ambient”
Claim · model-written summary
S.litura larval duration was two days longer on elevated CO2 foliage.
Verbatim
e0“Larvae of A. janata and S.litura consumed slowly on elevated CO2 foliage as noticed by lower coefficients with an increase of two days larval duration than those of chamber and open ambient”
Claim · model-written summary
Trichoderma viride sporulation increased under elevated CO2.
- Treatment
- elevated CO2e0
- Interactor
- Trichoderma viride
 Trichoderma viridee0biocontrol_agent
- Outcome
- sporulatione0
- Direction
- increasede0
Not reportedTaxonComparator
Organisms pictured · Representative pictures of the matched species, not figures from the paper.
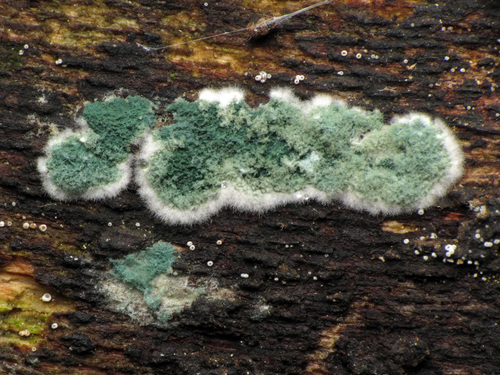
Verbatim
e0“sporulation increased in Trichoderma viride under elevated CO2”
Claim · model-written summary
Trichoderma viride growth was 15–20% slower by generation 15 than generation 1.
- Interactor
- Trichoderma virideTrichoderma viridee1biocontrol_agent
- Outcome
- growthe0
- Direction
- slowe0
- Value
- 15–20%e0
- Comparator
- 1st generatione0
Not reportedTaxon
Organisms pictured · Representative pictures of the matched species, not figures from the paper.
Verbatim
e0“the growth was 15–20% slow at 15th generation when compared to the 1st generation”
e1“Trichoderma viride”
Claim · model-written summary
Trichoderma viride substrate competition efficacy remained unchanged through generation 15.
- Interactor
- Trichoderma virideTrichoderma viridee1biocontrol_agent
- Outcome
- bioefficacy of the strains in terms of competition for substratee0
- Direction
- remained unalterede0
Not reportedTaxon
Organisms pictured · Representative pictures of the matched species, not figures from the paper.
Verbatim
e0“bioefficacy of the strains in terms of competition for substrate remained unaltered up to 15th generation”
e1“Trichoderma viride”
Claim · model-written summary
Pseudomonas PGPR traits were reduced under elevated CO2.
- Treatment
- elevated CO2 conditionse0
- Interactor
- Pseudomonas
 Pseudomonase0symbiont
- Outcome
- PGPR traits of Pseudomonase0
- Direction
- reducede0
Not reportedTaxonComparator
Organisms pictured · Representative pictures of the matched species, not figures from the paper.

Verbatim
e0“All the PGPR traits of Pseudomonas were reduced at elevated CO2 conditions”
Claim · model-written summary
Projected sorghum yield reductions in Anantapur were 8%, 18% and 30% in 2020, 2050 and 2080.
- Outcome
- sorghum yieldse0
- Direction
- reducede0
- Value
- 8%, 18% and 30%e0
- Qualifier
- 2020, 2050 and 2080e0
- Setting
- Anantapure0
 Sorghum
Organisms pictured · Representative pictures of the matched species, not figures from the paper.

Verbatim
e0“in Andhra Pradesh, sorghum yields reduced by 8%, 18% and 30% by 2020, 2050 and 2080, respectively, for Anantapur”
Claim · model-written summary
Projected sorghum yield reductions in Palem were 2.2%, 5.1% and 9.7% in 2020, 2050 and 2080.
- Outcome
- sorghum yieldse1
- Direction
- reductionse0
- Value
- 2.2% 5.1% and 9.7%e0
- Qualifier
- 2020, 2050 and 2080e0
- Setting
- Paleme0
Organisms pictured · Representative pictures of the matched species, not figures from the paper.
Verbatim
e0“for Palem the reductions were only 2.2% 5.1% and 9.7% in the years 2020, 2050 and 2080, respectively”
e1“sorghum yields reduced”
The same questions in other papers
co2 · yield · Ricinus communis (castor bean)Results agree
1 paper in the same direction as this paper
- positive
co2 · quality: protein · Arachis hypogaea (peanut)Results agree
2 papers in the same direction as this paper
- negative
- negative
Claims are grouped by organism, treatment and what was measured or targeted. A paper counts as positive when any of its claims in the group is positive.